
- NITI Aayog annually ranks Indian states on different Sustainable Development Goals (SDGs), highlighting their performance on indicators like hunger, education and healthcare access.
- It also measures the states’ progress on climate action, access to energy and sustainable cities among other criteria.
- In its latest report, the Niti Aayog modified and removed some indicators, as compared to its base report of 2018, which does not give a complete picture of the progress on these indicators.
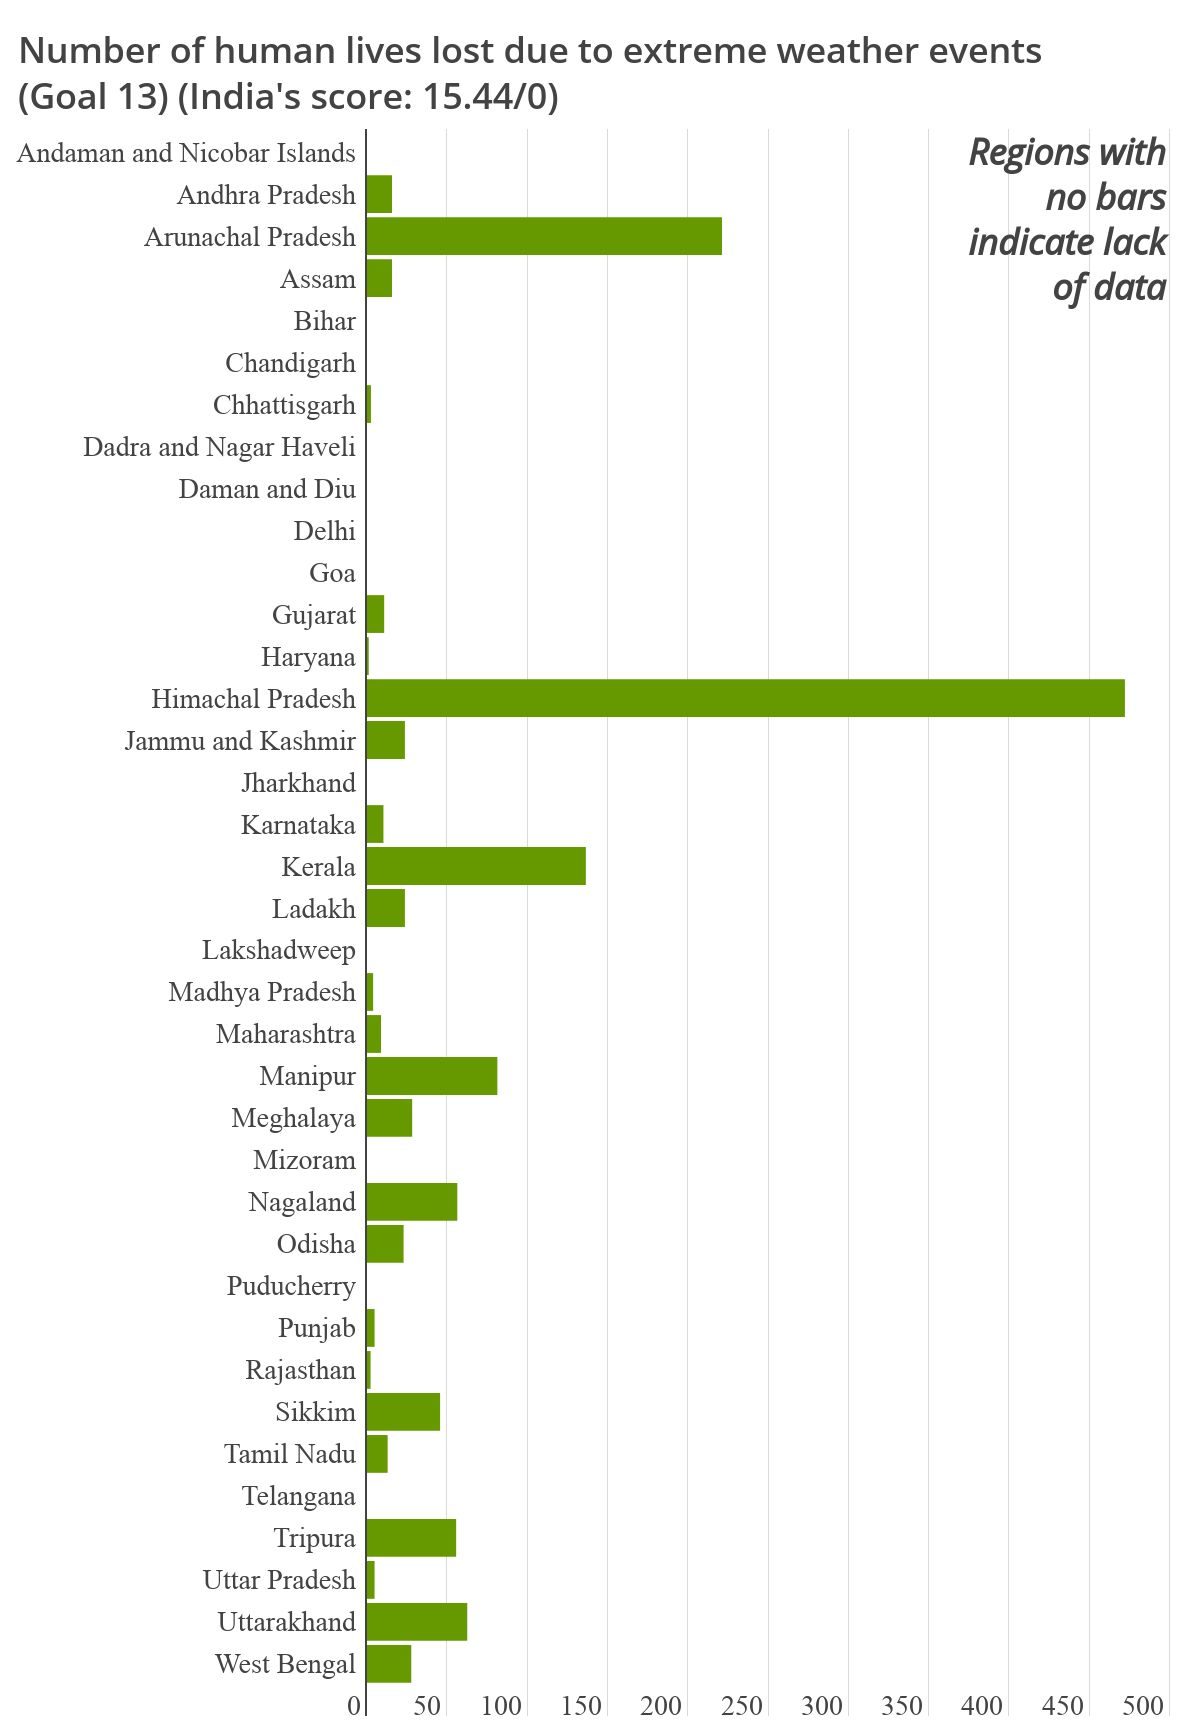
As many as 12 states and union territories in India have recorded no deaths due to extreme weather events − or they don’t have any mechanism to monitor the same − as per the NITI Aayog’s Sustainable Development Goals (SDGs) India Index report 2021 which ranks states’ performance and journey towards achieving SDGs. The union government’s own record, however, contradicts the claims. It highlights that the states like Bihar, Goa and Jharkhand have recorded deaths due to extreme weather events in the same time period.
In 2015, the United Nations set 17 goals, commonly known as SDGs, for countries to achieve a sustainable and better future for all by 2030. These goals include eradication of poverty, access to education, healthcare, reducing inequalities. It also includes goals that are directly connected to the biggest concern of the present times − climate change. Seven out of the 17 goals are about sustainability, climate action, life below water, energy access and similar subjects.
In a series of infographics, Mongabay-India explains the state rankings based on various parameters and India’s progress on the particular goals, as reflected in the report that was released on June 3 this year.
Click left/right for overall scores of seven SDGs out of 17 for all Indian states and union territories. Hover/tap on the bar to see individual scores. Data from SDG India Index and Dashboard 2020–21.

Key factors emerging
Goal 6 of the SDG is Clean Water and Sanitation meant to ensure access to water and sanitation for all. A total of eight indicators have been used to rank the states on goal 6. The Niti Aayog report says that 88.40% of the industries in India are complying with wastewater treatment as per Central Pollution Control Board’s (CPCB) norms. Delhi performs worst among Indian states and UTs with just 53.44% of industries complying with the CPCB wastewater treatment norms. It also gives glimpses of how the rural population is unable to access improved drinking water and highlights that states like Assam (74.72%) and Tripura (84.84%) have miles to cover compared to other states in terms of the percentage of the rural population having improved source of drinking water. The report also says that just half of India’s rural population − 51% − receives safe and adequate drinking water within the premises through piped water supply.

Goal 7 is Affordable and Clean Energy which aims to ensure access to affordable, reliable, sustainable and modern energy for all. To measure this, NITI Aayog has picked two national-level indicators including the percentage of households electrified and the percentage of LPG and PNG connections together, against the number of households. The Aayog has given 100 marks to 21 states and UTs. India has scored 99.99 in connecting households with electricity. However, these two sub-goals don’t explain the reliability and sustainability of modern energy for all.
Goal 11 talks about Sustainable Cities and Communities. It relies on eight indicators. One of the prominent indicators is the percentage of urban households with drainage facilities. On this criteria, northeast states like Arunachal Pradesh (59.4%), Nagaland (59.5%), Mizoram (52%) are quite behind from national average of 87.6%. Another important indicator used to monitor the goal is the installed sewage treatment capacity as a percentage of sewage generated in urban areas; India scores 38.86 on it.

Goal 12 talks about Responsible Consumption and Production. For this, NITI Aayog has used seven indicators including per capita fossil fuel consumption, plastic waste generated per 1,000 population, percentage of Bio-Medical Waste (BMW) treated to the total quantity of BMW generated. The BMW indicator is significant in the face of the global COVID-19 pandemic where this type of waste has emerged as a serious concern. In states like Bihar and Chhattisgarh, just 25 percent of BMW is treated properly, according to the report
Goal 13 is Climate Action. NITI Aayog has used five indicators to rank states on this criteria and Bihar has scored 16 (out of 100). The state has been talking about its effort to fight climate change in the last few years and has a climate change division as well.
However, the state has not been able to develop a mechanism of counting the loss of lives due to extreme weather events, as reported in the NITI Aayog report. The Centre’s own record claims that Bihar has lost 690 people due to extreme weather events in 2019.
SDG 14 measures states’ performance on maintaining Life Below Water. NITI Aayog has ranked just nine states which touch coastal areas. Out of these, Tamil Nadu scores just 11. The Aayog has used five indicators to rank states. It includes a percentage increase in area under mangroves. On this criteria, Tamil Nadu has scored negative while Maharashtra has seen the highest increase. Similarly, there is a criterion of percentage of available potential area developed under aquaculture and in this, West Bengal leads with 63.9% of its potential being used for the same. But Goa has managed to use just 1.4% of its total potential for developing aquaculture.
SDG 15 talks about Life on Land. It aims to work for protecting, restoring and promoting sustainable use of terrestrial ecosystems, sustainably managing forests, combating desertification, and halt and reverse land degradation and halt biodiversity loss. NITI Aayog has used a total of six criteria to score the states. It includes forest cover as a percentage of total geographical area, tree cover as a percentage of total geographical area, percentage increase in area of desertification and the number of cases under Wildlife Protection Act (1972) per million hectares of protected area. Haryana, Mizoram, Punjab and Rajasthan have performed the worst in achieving this goal.
Changing indicators does not give a full picture of progress
In the reports over the years, it is observed that the NITI Aayog keeps changing its indicators within some goals. For example, it has included ‘Installed sewage treatment capacity as a proportion of sewage created in urban areas (%)’ as an indicator in Goal 6 in the 2018 report. However, in the 2021 report, this particular indicator has been removed from Goal 6 and feature in Goal 11 which talks about sustainable cities and communities.
Over the past four years and consecutive reports, the overall score of India has remained almost the same. In 2018, India scored 37.58 while in 2021, it has shown a negligible increase with a score of 38.86.
Under Goal 7 as well, in the 2018 report, NITI Aayog used ‘Renewable share of installed generating capacity (%)’ as an indicator of the Affordable and Clean Energy Goal. However, it removed and shifted this indicator to Climate Action (Goal 13).
The yardstick to measure India’s composite score on this indicator has also changed – in 2018, India’s composite score was 43 out of 100. In 2021, the score was 36.37 but out of 40. The changing goalpost is a barrier to understanding long-term progress and trends.
The report had used demand and supply of houses under Pradhan Mantri Awaas Yojna (PMAY) in 2018 which has been removed in the 2021 report. The indicator appeared under SDG 11 (Sustainable Cities and Communities), in its 2018 report, where the Aayog has used ‘Houses completed under PMAY as a percentage of net demand assessment for houses’. India’s composite score was 3.32 out of 100 in 2018. However, this year it has removed this indicator altogether.
Read more: SDGs provide direction for sustainable post-COVID recovery
Banner image: Changing indicators make it difficult to monitor growth and trends. Photo by Kamaljith K V/Flickr.