
- Many factors ranging from urban planning to materials used in construction, as well as the loss of blue and green cover, are responsible for the the Urban Heat Island (UHI) effect that causes variance in temperatures within neighbourhoods in a city.
- By recording temperatures of different neighbourhoods in New Delhi and in Mumbai, on a normal summer day in 2021, the article illustrates temperature variance within the cities.
- Built environment experts highlight the impact of urban development on the formation of Urban Heat Islands, the social inequalities of the impact and effective development strategies for the future of Indian cities.
The summer of 2022 has been particularly harsh all over India, with unrelenting heat spells signalling evolving climatic systems. With March being declared as the hottest in the India Meteorological Department’s 122-year recorded history and April being the third hottest since 1901, the news about the heatwave has captured wide attention.
The increase in heat, however, is not a one-off event, especially in urban areas due to a phenomenon known as Urban Heat Island (UHI) Effect which is “the relative warmth of a city compared to its surrounding rural areas”.
With 56.2 percent of the world’s population living in urban areas as of 2020, all that the cities comprise – materials used and their ability to absorb or reflect heat, designs of urban spaces and geometry that allow or block the passage of heat, presence or lack of ecological infrastructure such as trees, parks, wetlands and water bodies as well as sources of anthropogenic heat – play a significant role in the heating of urban spaces.
Based on how cities evolve, each neighbourhood has its own mix of UHI-contributing factors in different proportions which leads to a variance in temperatures not only between the city and its surrounding areas but within a city as well.
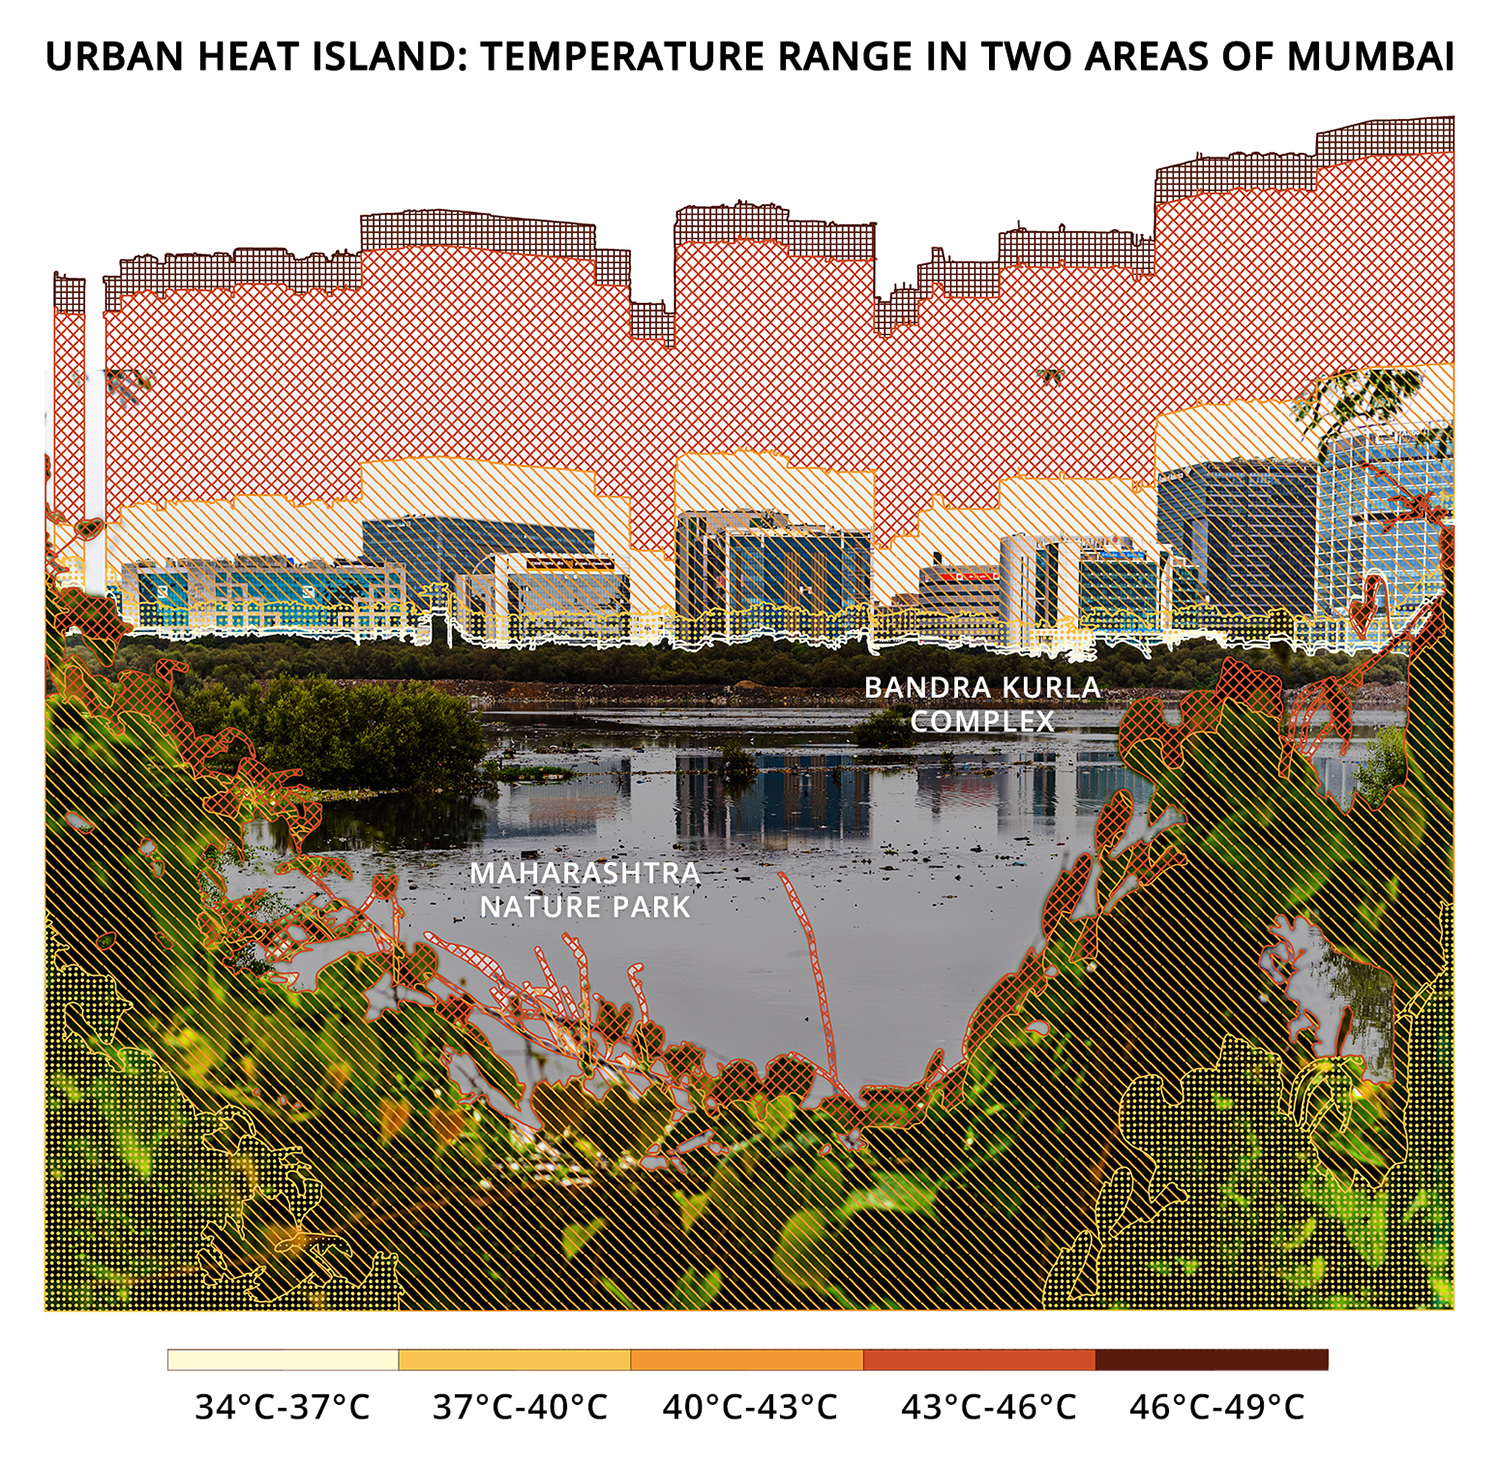
In order to illustrate this phenomenon, we gathered data from different neighbourhoods in Mumbai and Delhi, including their recorded minimum and maximum surface temperatures at a given time, on a regular summer day in 2021.
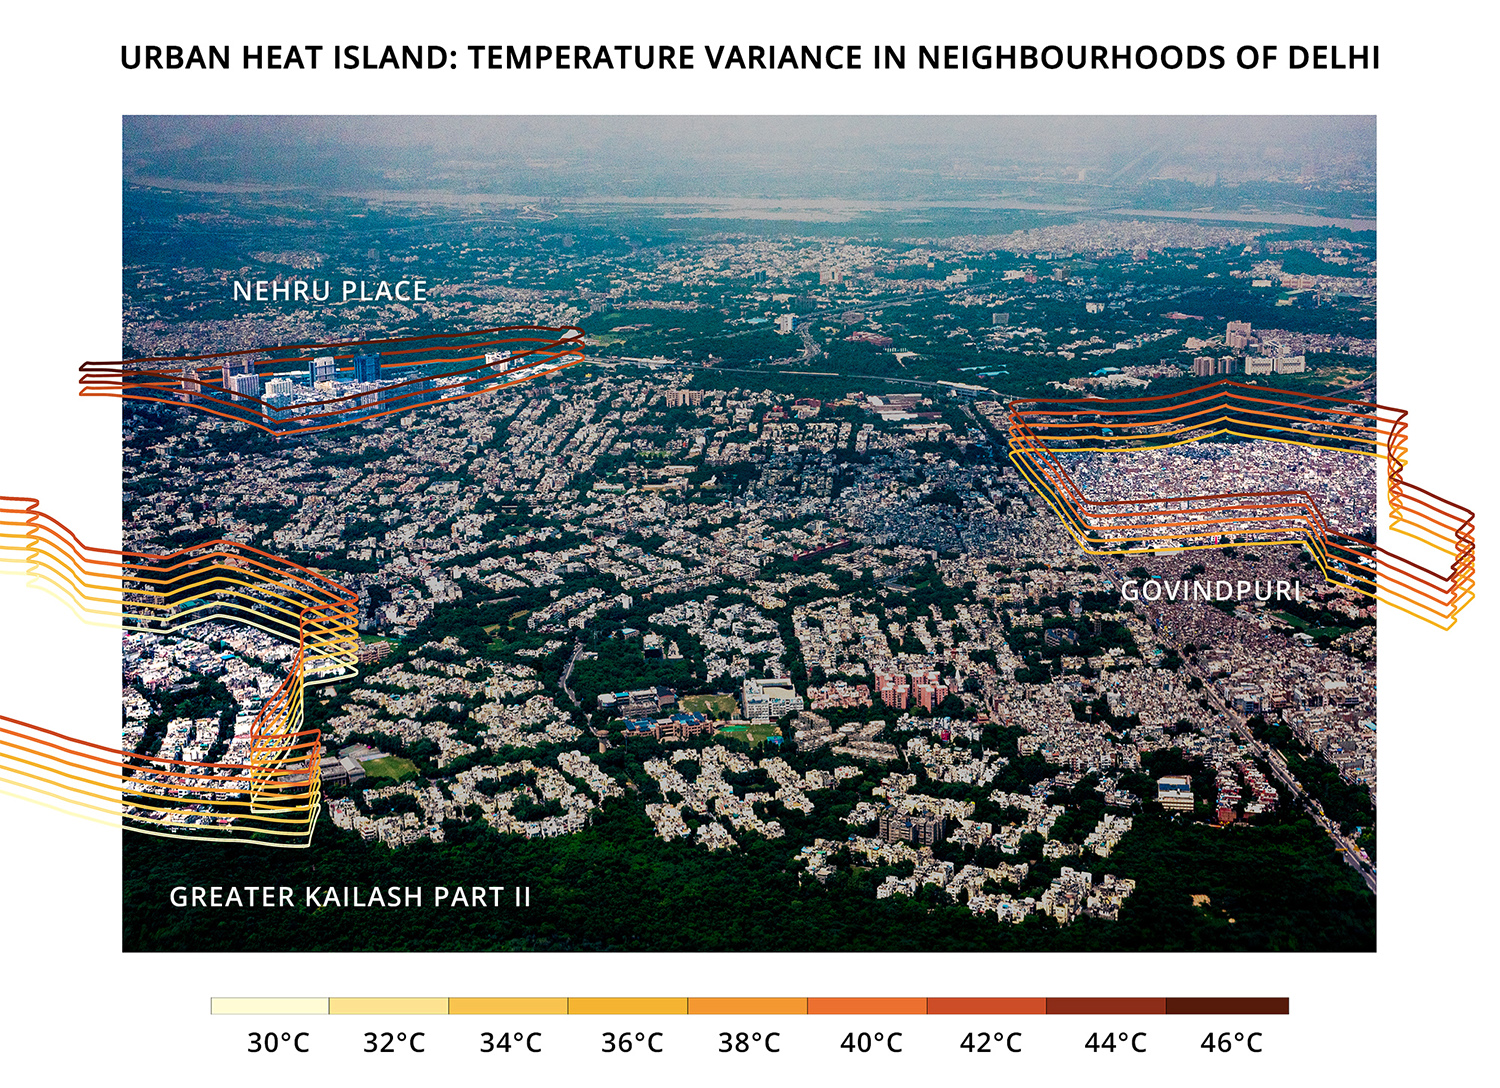
In Delhi, temperatures were recorded in Nehru Place, Govindpuri and Greater Kailash II on May 3, 2021. “Govindpuri is typically a very low-income area,” says Ronita Bardhan, Associate Professor of Sustainability in Built Environment, University of Cambridge. “There (in Govindpuri), temperatures reaching 45 degrees Celsius is fatal, whereas, if you see Greater Kailash II (a higher-income neighbourhood), its temperature reaching 45 degrees Celsius is not as fatal as it would be in Govindpuri,” she says.
She further explains that in Greater Kailash II, people have the means to cool their homes using air conditioners. However, the heat refuse from the mechanical ventilation contributes to artificially raising the outdoor temperature, creating hotspots which burden the urban poor, such as the residents of Govindpuri. She also says that if everyone proceeded to turn on their air conditioners to cool the indoor environment, there would yet be an elevation in the temperature in the high-income neighbourhood with tree-lined streets and several parks.
Read more: Staying indoors in heat-vulnerable, low-income neighbourhoods
When the green and blue spaces decrease in cities
With vegetation and water bodies known to regulate the temperature within cities, a decrease in green and blue cover can be contributing factors to the Urban Heat Island Effect. Amir Bazaz, Associate Dean, School of Environment and Sustainability at Indian Institute for Human Settlements, sheds light on the loss of natural cover in urban areas. “Jobs are in the cities. People move to the cities, and therefore rural incomes have not increased substantially. There is also an aspiration change between generations – people are increasingly preferring to come to the cities to generate more income, instead of pursuing agriculture,” he explains. “Cities are melting pots of opportunity or places where minds meet and innovation happens. That’s how people increase their incomes. So, if people rush to cities, where will we build our houses?” he questioned, pointing out that the built environments expand to take over green and blue spaces.
For Mumbai, the two localities chosen (Maharashtra Nature Park and Bandra Kurla Complex) are in close proximity to each other, on either bank of the Mithi river but with extremely varying characteristics. Maharashtra Nature Park is a human-made forest, developed on a former dumping ground, and is surrounded by mangrove forest on the Mithi river, whereas Bandra Kurla Complex is a bustling commercial and government complex, built on low-lying land that lacked proper surface drainage along the Mithi river.
According to the UN’s Intergovernmental Panel on Climate Change (IPCC), the urban heat island effect is further amplified in cities that lack vegetation and water bodies, both of which can strongly contribute to local cooling. The IPCC’s Special Report: Global Warming of 1.5 ºC further predicts with high confidence that “urban heat islands often amplify the impacts of heatwaves.”
Bardhan explains this development-linked impact on urban heat islands, saying, “We must first accept that urbanisation will densify our cities and it’s inevitable. We can’t just fight it and it’s wrong to fight it because otherwise, how does development happen? We can intelligently layout our buildings, we can intelligently design our neighbourhoods in such a way that we create escape routes for heat.”
With building materials accounting for 10 percent of emissions while 50 percent of emissions stem from operational energy, Bardhan makes a case for an optimal mix of both materials and design to help reduce the heat burden in our cities. “The physics is not only to restrict the heat coming from outside to the inside but also create spaces indoors or create ventilation strategies indoors so that indoor heat is released,” she concludes.
The illustrations cannot be extracted and used independently. Please follow our republishing guidelines here.
Banner image: Illustration by Alisha Vasudev/Mongabay.